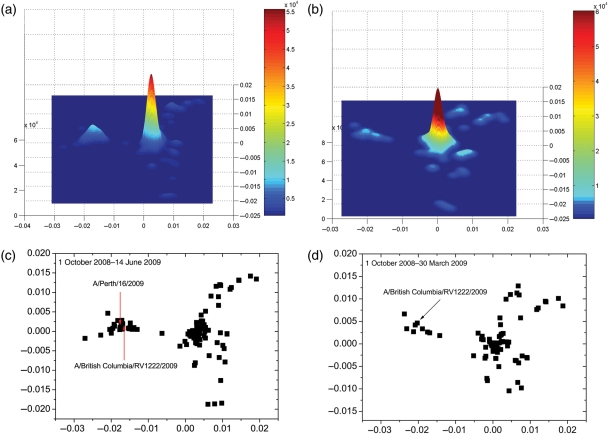
Fig. 5.
(a) Kernel density estimation and (c) protein distance map for H3N2 viruses from 1 October 2008 to 14 June 2009. (b) Kernel density estimation and (d) protein distance map for H3N2 viruses between 1 October 2008 and 30 March 2009. The vertical and horizontal axes of all figures represent protein distance as defined in Equation (1). A 0.0030 unit of protein distance equals one substitution of the HA1 protein sequence of H3N2.

