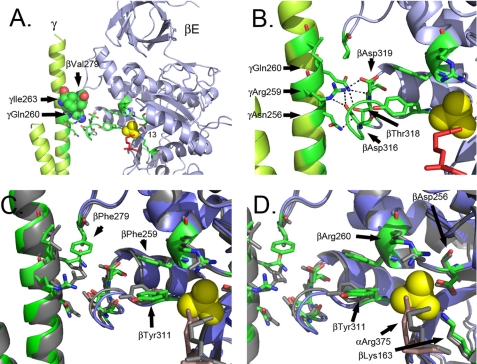
FIGURE 3.
Structural changes observed in the F1 structure with mgi mutation, βVal279Phe. A and B show the structure of the β- and γ-subunits of wild-type F1 from yF1II. A shows a position of βVal279 and the interacting residues on the γ-subunit. B shows the interactions in the Catch 2 region between the residues of the β- and γ-subunits. The atoms colored in red correspond to αArg375. C and D show an overlap of the wild type (gray) and mutant structures (green and blue) and the relative shifts in positions. The atoms colored in dark salmon correspond to αArg375. The shift in the residues eliminates the H-bonds in the Catch 1 region in the mutant structure, and phosphate is not bound in the mutant structure.

