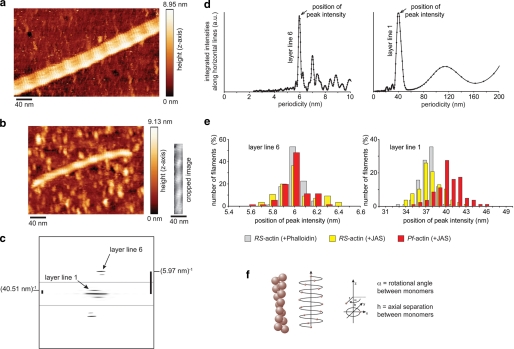
FIGURE 4.
Atomic force microscopy. Atomic force micrographs of (a) RS-actin (scan resolution = 1.43 nm·pixel−1) and (b) Pf-actin filaments (scan resolution = 1.17 nm·pixel−1), both polymerized in the presence of JAS. The cropped image shows the straight segment of the filament (172 nm) used for further analysis. c, Fourier transform of the straight segment of the Pf-actin filament shown in b after background cropping and padding to 2000 by 2000 nm (the area near the equator and the one further to the equator were individually optimized for contrast). d, intensities were integrated along horizontal lines to produce the projections shown here. For layer line 1 (half-pitch of the two-start helix) the position of the highest peak of integrated intensities (peak intensity) in the range of 0–50 nm was taken. For layer line 6 (pitch of the genetic helix) the highest peak of integrated intensities in the range of 0–8 nm was taken. The distributions of these peaks in d are shown in the histograms in e. For RS-actin +JAS the mean ± S.D. for layer line 1 was 37.7 ± 1.8 nm (n = 77), for layer line 6 we found 6.02 ± 0.17 nm (n = 55). For RS- actin +phalloidin, we measured 37.4 ± 1.3 nm (n = 76) for layer line 1 and 6.01 ± 0.08 nm (n = 62) for layer line 6. For Pf-actin, we found 40.4 ± 2.0 nm (n = 80) for layer line 1 and 6.00 ± 0.12 nm (n = 71) for layer line 6. f, model illustrating the genetic and the two-start helix.

