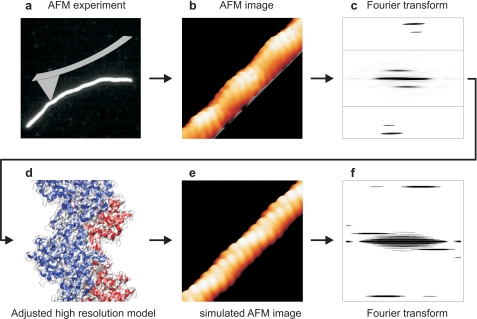
FIGURE 6.
Scheme of AFM imaging and modeling. a–c, AFM images were analyzed by Fourier transformation to determine the pitches of the genetic and the two-start helix for each image. From these pitches, the parameters α and h were calculated. d and e, molecular model was generated using α and h to simulate the AFM images analyzed using Fourier transformation (f).

