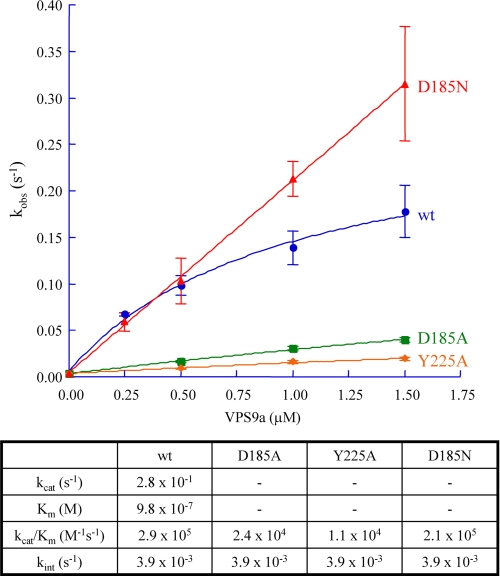
FIGURE 7.
GEF activity of VPS9a. The pseudo-first order rate constants are plotted against the concentrations of the wild-type and three mutants of VPS9a. For the wild-type VPS9a, the maximum rate constant and the apparent dissociation constants are estimated. Values of the rate constants are to be compared with the intrinsic nucleotide exchange rate of ARA7 in the absence of VPS9a, kint, 3.9 × 10⁻³ (1/s). Values of the dissociation constants are summarized in the table below the plots.

