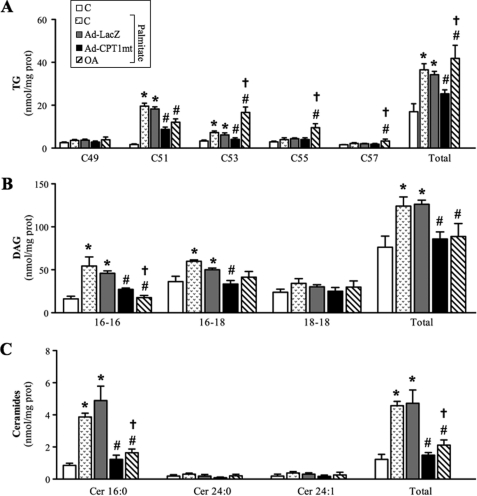
FIGURE 5.
Effect of CPT1mt expression and OA on lipid composition in C2C12 myotubes exposed to palmitate. Cells were treated and cultured as described in the legend to Fig. 3. Lipids were extracted from myotubes and analyzed as described under “Experimental Procedures” to determine cellular TG (A), DAG (B), and ceramide (C) contents. Data are means ± S.E. (error bars) of three experiments performed in duplicate. *, p < 0.05 versus control (C) without palmitate; #, p < 0.05 versus C or Ad-LacZ exposed to palmitate; †, p < 0.05 versus Ad-CPT1mt.

