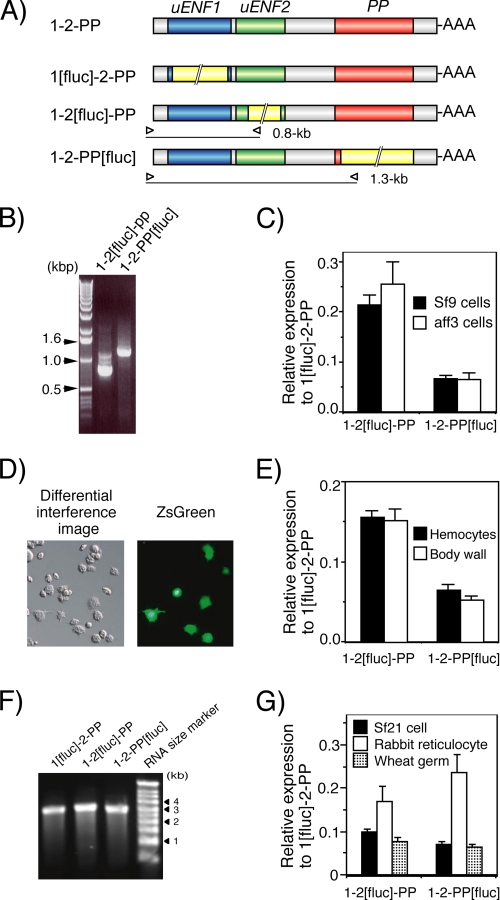
FIGURE 5.
Significant amounts of uENF2 and PP precursor proteins are translated from the uENF1-uENF2-PP tricistronic mRNA, indicated by luciferase reporter assays using cell lines, larval tissues, and cell-free systems. A, shown is a schematic representation of mRNAs used in the reporter assays. The firefly luciferase ORF (1.7 kb), indicated by a yellow box with a double diagonal line, was inserted in-frame in each ORF. Open triangles indicate positions of primers used for 5′-RACE analysis in panel B. The calculated size of 5′-RACE product amplified from each mRNA is indicated on the right side of the triangle, which represents the reverse primer that was designed based on the nucleotide sequence of the luciferase ORF. B, 5′-RACE analysis of mRNAs expressed in Sf9 cells after lipofection of the reporter plasmids is shown. As shown, a DNA fragment of the expected size indicated in panel A was amplified from the cells that were transfected with the plasmid expressing the indicated mRNA, confirming that luciferase was truly translated from the luciferase ORF-containing tricistronic mRNAs and not from the processed monocistronic mRNAs. C, shown are relative levels of expression from uENF2 and PP ORFs compared with that from the uENF1 ORF in two cell lines as determined by the luciferase reporter assay. Error bars represents S.E. (n = 42 for Sf9 cells and n = 10 for aff3 cells; each replicate represents average of data from 3–4 wells). Experiments were repeated using a total of 4 different lots of reporter plasmids on 11 and 3 different days for Sf9 and aff3 cells, respectively. D, expression of ZsGreen1 protein in hemocytes 3 days after in vivo lipofection of pIB-ZsGreen into newly molted third instar larvae is shown. Strong green fluorescence was observed in some hemocytes, particularly in the granulocytes. E, shown are relative levels of expression from the uENF2 and PP ORFs compared with that from the uENF1 ORF in the hemocytes and body wall after in vivo lipofection of the reporter plasmids into newly molted third instar larvae as determined by the luciferase reporter assay. Error bars represents S.E. (n = 20 for both tissues). Each datum was obtained from one individual. Experiments were repeated on two different days. F, ethidium bromide staining of the tricistronic RNAs synthesized in vitro and separated on a denaturing agarose gel show that a single band of RNA of an expected size (2.7–2.9 kb) was present on each lane. G, relative levels of expression from the uENF2 and PP ORFs compared with that from the uENF1 ORF in cell-free systems was determined by the luciferase reporter assay. After confirming the purity of RNAs synthesized in vitro by electrophoresis as in panel F, equal amounts of the RNAs were used for in vitro translation reactions using the cellular lysates prepared from three organisms in parallel. Error bars represents S.E. (n = 4). Four different sets of RNAs were synthesized independently and used for the in vitro translation reactions.

