FIGURE 3.
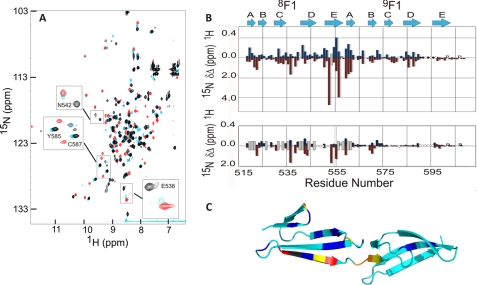
Identification of the FnZ peptide binding site and binding orientation on 8F19F1 using NMR spectroscopy. A, overlay of the 1H15N HSQC spectra of free 8F19F1 (black) and of 8F19F1 bound to the FnZ (red) and LAGESGET (cyan) peptides. Highlighted residues are mentioned under “Results.” B, chemical shift perturbation map for 15N-labeled 8F19F1 upon binding to the FnZ (top) and LAGESGET (bottom) peptides. Blue and red bars indicate absolute chemical shift differences in backbone amide 1H and 15N nuclei, respectively, between free and peptide-bound 8F19F1. P, proline residues; ○, unassigned residues; ●, residues previously unassigned but now identified. The approximate location of previously defined secondary structure elements of the F1 modules are shown above. Peaks that disappear upon peptide binding from their chemical shift in free 8F19F1 but cannot be assigned in the peptide-bound spectrum are indicated by a gray bar of arbitrary size. C, location of combined chemical shift perturbations (square root of (ΔδHN2 + 0.2ΔδN2)) on FnZ peptide binding mapped onto the structure of 8F19F1 (17) (Protein Data Bank entry 3EJH). Small to large chemical shift changes are indicated by as follows: cyan < blue < yellow < orange < red and Trp553 (gray; prepared using PyMOL) (35).

