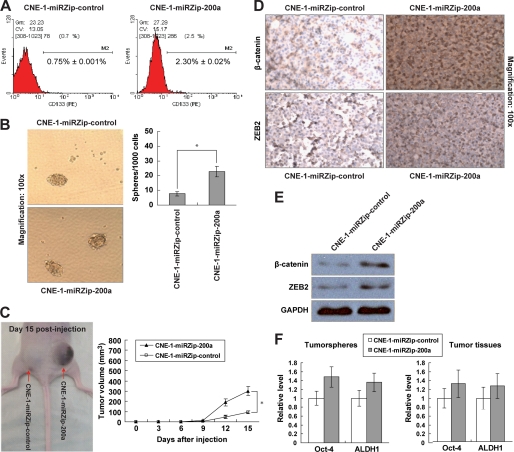
FIGURE 2.
Induction of stem-like cell phenotypes by stable knockdown of miR-200a in CNE-1 cells. A, flow cytometry analysis of CD133+ cell distribution in CNE-1-miRZip-control and CNE-1-miRZip-200a cells (1 × 10⁶ cells per sample). The numbers represented the mean percentage of CD133+ cells from triplicate data. PE, phycoerythrin. B, representative images of tumor spheres generated after 14 days of single cell cultures. The bar graph indicated the number of spheres with diameter of at least 40 μm per 1 × 10³ single cell seeded. C, subcutaneous NPC tumor in nude mouse (n = 6) at 15 day post-injection of CNE-1-miRZip-control and CNE-1-miRZip-200a cells (5 × 10⁶ cells). The graph indicated the tumor volume measured every 3 days for 15 days. D, IHC staining; E, Western blotting analysis of β-catenin and ZEB2 protein expressions in tumor tissues. F, quantitative PCR analysis of Oct-4 and ALDH1 mRNA expressions in tumor spheres (left) and tumor tissues (right). *, p < 0.05, as compared with CNE-1-miRZip-control group.

