FIGURE 3.
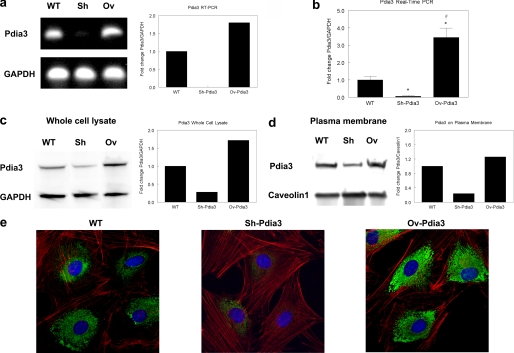
Silencing and overexpression of Pdia3 in MC3T3-E1 cells: RT-PCR, real-time PCR, Western blot and confocal microscopy. a, RT-PCR. Left: gel electrophoresis of RT-PCR product. Right: quantitative RT-PCR for the fold change of Pdia3 levels relative to GAPDH control. b, real-time PCR. Fold change of Pdia3 levels relative to GAPDH control. c, Western blot of whole cell lysate. Left: blotting image. Right: quantitative Western blot for the fold change of Pdia3 levels relative to GAPDH control. d, Western blot of plasma membranes. Left: blotting image. Right: quantitative Western blot for the fold change of Pdia3 levels relative to GAPDH control. e, confocal microscopy of permeabilized cells. Red: actin; green: Pdia3; blue: nucleus. Cells were permeabilized before staining.

