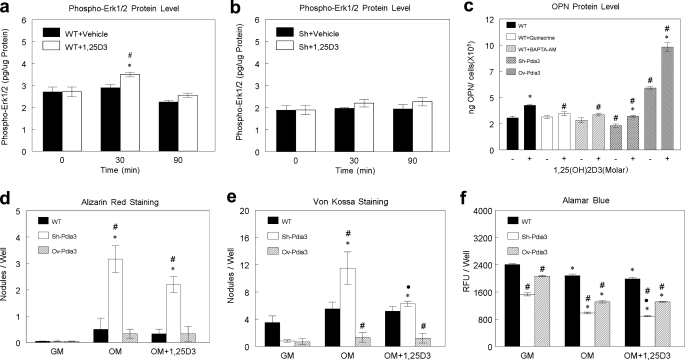
FIGURE 6.
Effect of 1α,25(OH)2D3 on ERK1/2 phosphorylation, OPN secretion, and in vitro mineralization in wild-type, Sh-Pdia3, and Ov-Pdia3 cells. a and b, wild-type and Sh-Pdia3 MC3T3-E1 cells were treated with vehicle (ethanol) or 10−8 m 1α,25(OH)2D3 for 9 min. The media were replaced, and cells were harvested at 0 min (no treatment), 30 min, and 90 min after treatment. Intracellular phospho-ERK1/2 was measured by ELISA and normalized to total protein. c, wild-type, Ov-Pdia3, and Sh-Pdia3 MC3T3-E1 cells were treated with vehicle (ethanol) or 10−8 m 1α,25(OH)2D3 for 9 min with or without 10−5 m quinacrine or 10−6 m BAPTA-AM. After 9 min, the media were replaced and after 24 h, OPN was measured in the conditioned media using an ELISA assay. OPN levels were normalized to cell number. d—f, wild-type, Ov-Pdia3, and Sh-Pdai3 cells were cultured in growth media or osteogenic media with or without pulse treatments (9 min) with 10−8 m 1α,25(OH)2D3 every 48 h. Four weeks after seeding, cultures were examined by alamar blue, alizarin red, and van Kossa staining. d, number of alizarin red-positive nodules; e, number of von Kossa-positive nodules. f, relative fluorescence units of alamar blue stain. Numbers indicate the cell viability. Each data point represents mean ± S.E. for n = 6 independent cultures. *, p < 0.05, 30 min, and 90 min versus 0 min for a and b or 1α,25(OH)2D3 versus vehicle (ethanol) for C or OM± 1α,25(OH)2D3 versus GM for d, e, and f; ●, p < 0.05, OM+1α,25(OH)2D3 versus OM-1α,25(OH)2D3 for d, e, and f; #, p < 0.05, 1α,25(OH)2D3 versus vehicle (ethanol) for A and B or Sh-Pdia3, Ov-Pdia3, and WT with inhibitors versus WT for the same conditions for c, d, e, and f.

