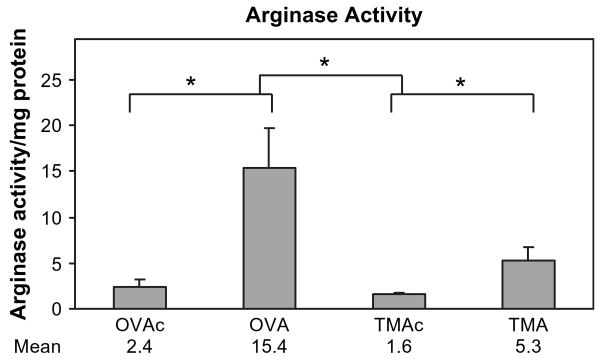
FIG. 5.
Arginase activity in lungs 72 h after challenge. OVA-sensitized animals were challenged with either 400 μg MSA (OVAc) or OVA (OVA), and TMA-sensitized animals were challenged with either 400 μg MSA (TMAc) or TMA-MSA (TMA). Values represent the geometric mean + SE for n = 6 animals for each of the four treatment groups. *p < 0.05. The lower set of brackets depicts the comparison of each allergen to its respective control. The upper bracket indicates the statistical comparison of the change (OVA-OVAc vs. TMA-TMAc). Geometric mean values are listed under respective treatment groups.

