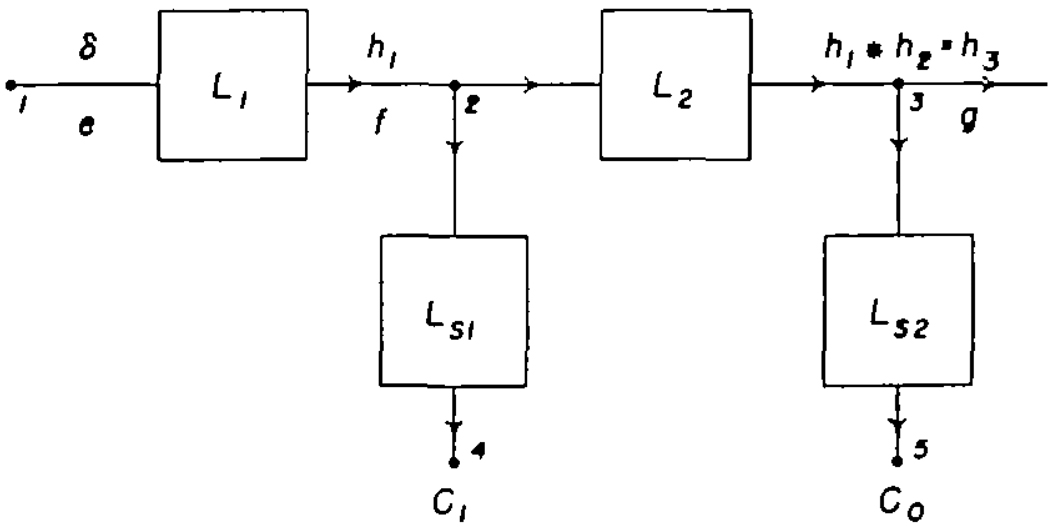
FIGURE 1.
Block diagram of the experimental situation. Point 1 (left) is the injection site, 2 is the tip of the femoral sampling system, 3 is the tip of the sampling system in the dorsalis pedis artery, and 4 and 5 are the recorded outputs of the densitometers of the femoral and dorsalis pedis sampling systems.

