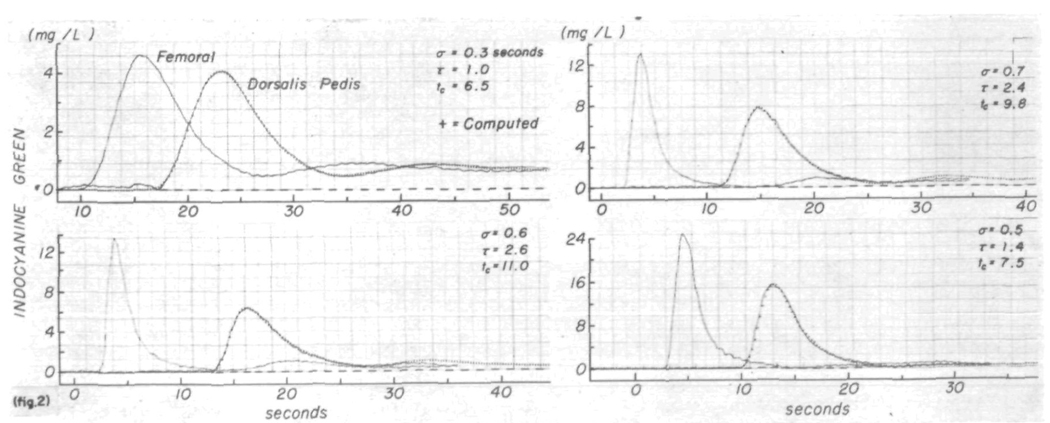
FIGURE 2.
Use of a lagged normal density curve as the transfer function relating pairs of time-concentration curves. The pair of curves (continuous lines) in each panel were recorded simultaneously from the femoral and dorsalis pedis arteries. Femoral curves were convoluted with lagged normal density curves whose parameters, σ, τ, and tc are listed. Computed output curves (+ signs) closely approximate the recorded dorsalis pedis curves. Coefficients of variation between these computed and recorded output curves were 0.003, 0.007, 0.009, and 0.012. The average coefficient of variation for all the experiments was 0.007. Curves in the left upper panel, recorded after injection into the superior vena cava, illustrate one of the best results. Aortic injections were used to produce the other curves.

