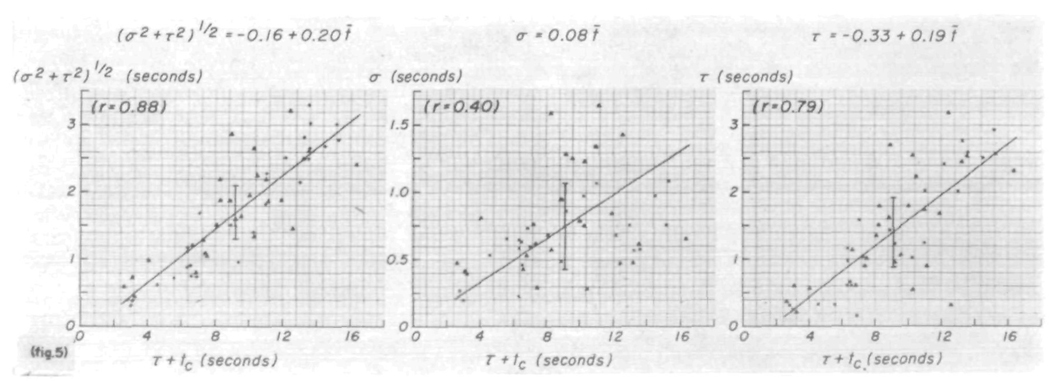
FIGURE 5.
Parameters of the model simulating the transfer function. Left panel dispersion, as estimated by the square root of the variance of the transfer function, (σ2 + τ2)½, is linearly related to the mean transit time, τ + tc (which equals t̄), in a manner similar to that seen for the recorded curves. Middle and right panels: σ and τ of the transfer function exhibit very scattered, approximately linear relationships to τ + tc. Triangles denote data recorded following injection into superior vena cava; +’s or x’s denote injection into the aorta. Length of the vertical line at the average point is two standard deviations.

