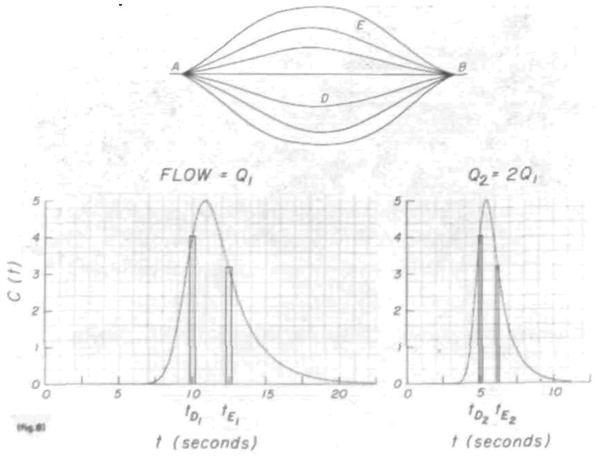
FIGURE 8.
Diagrammatic representation of the effect of change of flow rate in a generalized flow system. When the rate is doubled, the dilution curve is halved in area and the transit time through any particular path, D or E, between A and B is also halved. In such a system the various measures of the breadth of concentration-time curves are linearly related to the mean transit time.

