
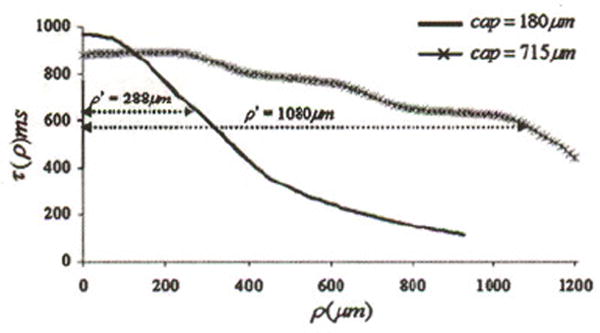
Fig. 3.
The figure shows τ(ρ) plotted versus distance ρ from the source entry point for two NCFAs with different cap thicknesses. The distance ρ′ at which τ(ρ) drops to 65% of its maximum value is shown, which is related to the cap thickness.
Official websites use .gov
A
.gov website belongs to an official
government organization in the United States.
Secure .gov websites use HTTPS
A lock (
) or https:// means you've safely
connected to the .gov website. Share sensitive
information only on official, secure websites.
The figure shows τ(ρ) plotted versus distance ρ from the source entry point for two NCFAs with different cap thicknesses. The distance ρ′ at which τ(ρ) drops to 65% of its maximum value is shown, which is related to the cap thickness.