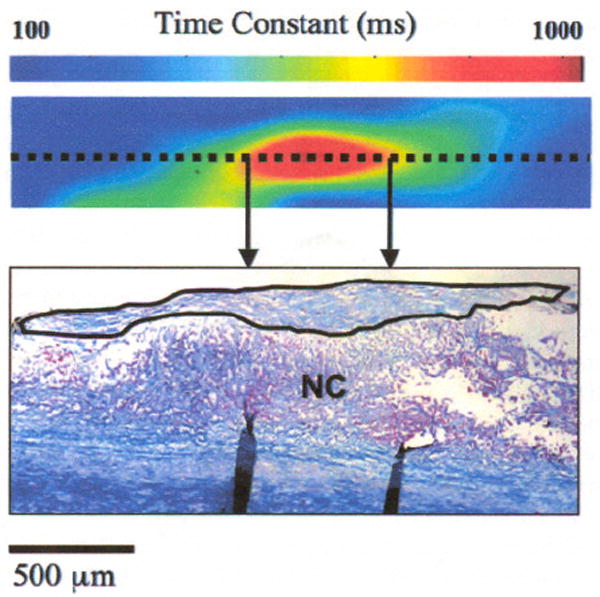
Fig. 4.

The colormap shows the spatial distribution of speckle decorelation time constants measured across a 0.6 × 2-mm region of a NCFA. The corresponding histological scetion obtained across the dotted line is shown in the figure, with the fibrous cap demarcated by the solid black line. A high decorrelation time constant (~900 ms) is measured at the center of the colormap corresponding to a thicker portion of the fibrous cap at the center of the NCFA, which rapidly drops (<100 ms) at the periphery of the colormap where the fibrous cap is very thin.
