
Fig. 6.
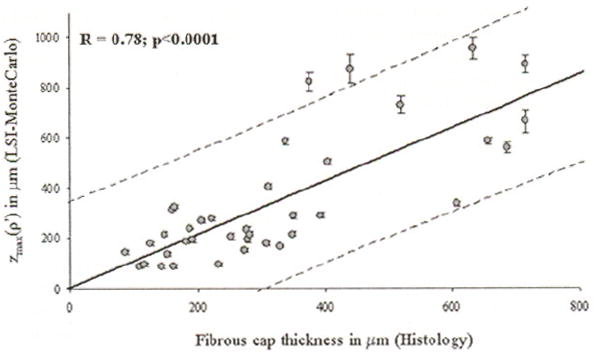
The parameter z̄max(ρ′), measured using the LSI-MC technique for ρ′ corresponding to 65% τmax, is plotted against fibrous cap thickness mesured from histoloty. The soild line depicts the linear least-squares fit through the data, and the dotted lines show the 95% prediction limits. A high correlation was observed between z̄max(ρ′) and NCFA fibrous cap thicknesses.