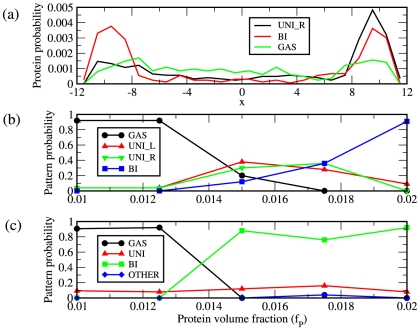
Figure 3. Classifying patterns based on protein distribution in cell.
(a) Protein probability density as a function of position along the cell,  measured in
  . Shown are the densities for diffuse (GAS), unipolar on the right (UNI_R) and bipolar (BI). (b) Shown are the resulting frequencies of protein patterns from 50 separate simulations at each value of
  for the cell geometry and DNA density described in Fig. 2a. (c) Same as in (b) except using a DNA volume fraction of
  . The frequencies of both unipolar patterns have been combined into a single unipolar classification, ‘UNI’ and patterns that result in domains elsewhere than at the poles are classified as ‘OTHER’.

