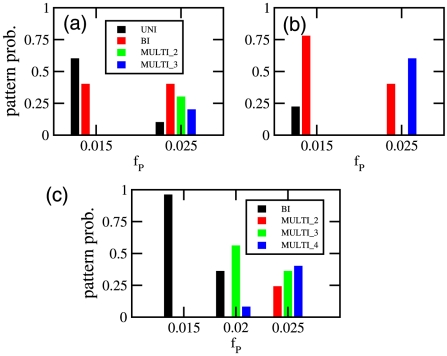
Figure 7. Summary of frequencies of observed patterns in multi-chromosomal cells.
Results for a cell possessing two chromosomes with (a) length  or (b) length
  . Diameter and DNA volume fraction are as in Fig. 6a. ‘MULTI_2’ corresponds to 2 protein domains, one in between the two chromosomes and one at a pole. ‘MULTI_3’ corresponds to all chromosome free regions being occupied by a protein domain. (c) Results for cells possessing three chromosomes. Here ‘MULTI_2’ are patterns with two protein domains that are not at both poles, ‘MULTI_3’ cells possess three domains and ‘MULTI_4’ cells have all chromosome free regions occupied by a protein domain. Frequecencies of patterns were found as a function of
  over 25 independent simulations at each value of
  and length,
  .
.

