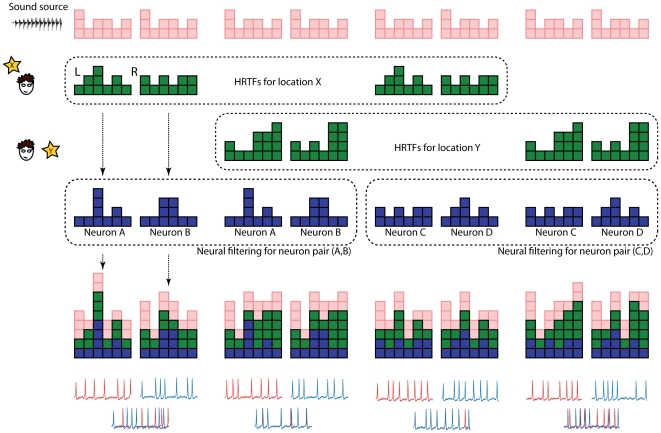
Figure 2. Relationship between synchrony receptive field and source location.
We represent each signal or filter by a set of columns, which can be interpreted as the level or phase of different frequency components (as in a graphic equalizer). In the first two columns, the sound source (pink) is acoustically filtered through the pairs of HRTFs corresponding to location X (green), then filtered through the receptive fields of neurons A and B (blue), and resulting signals are transformed into spike trains (red and blue traces). In this case, the two resulting signals are different and the spike trains are not synchronous. In the next two columns, the source is presented at location Y, corresponding to a different pair of HRTFs. Here the resulting signals match, so that the neurons fire in synchrony: location Y is in the synchrony receptive field of neuron pair (A,B). The next 4 columns show the same processing for locations X and Y but with a different pair of neurons (C,D). In this case, location X is in the synchrony receptive field of (C,D) but not location Y. When neural filters are themselves HRTFs, this matching corresponds to the maximum correlation in the localization algorithm described by MacDonald [16]. When neural filters are only phase and gain differences in a single frequency channel, the matching would correspond to the Equalisation-Cancellation model [18]–[20].

