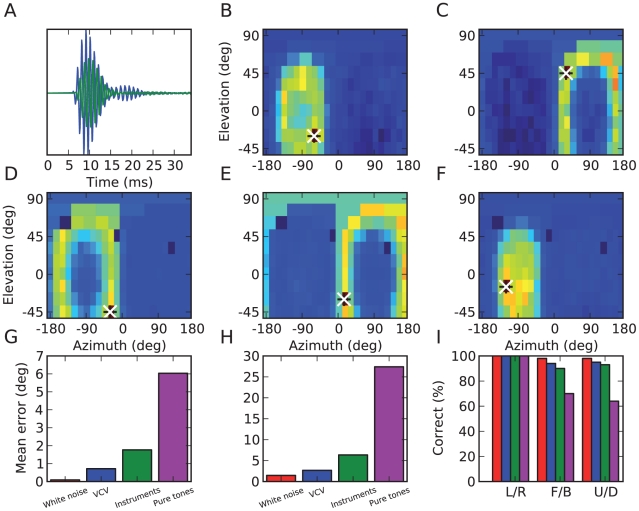
Figure 6. Estimation results in the ideal model.
(A) Left (blue) and right (green) head-related impulse responses (HRIR) for a particular location passed through a gammatone filter. (B, C) Activation of all location-specific neural assemblies for two particular source locations, represented as a function of their assigned location. The black+shows the sound location and the white x shows the model estimate (maximally activated assembly). (D–F) Spatial receptive fields of three neural assemblies, i.e., total activation as a function of source location. (G) Mean error in azimuth estimates for white noise (red), vowel-consonant-vowel (blue), musical instruments (green) and pure tones (magenta). Front/back confusions do not contribute to azimuth errors in this panel. (H) Mean error in elevation estimates. (I) Categorization performance discriminating left and right (L/R), front and back (F/B) and up and down (U/D).

