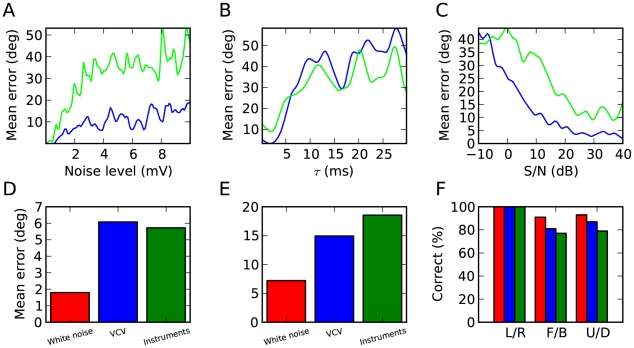
Figure 9. Robustness of the model.
(A) Mean error in azimuth (blue) and elevation (green) as a function of the level of intrinsic noise in the model, measured as the standard deviation of the membrane potential. (B) Mean error as a function of the membrane time constant of coincidence detector neurons. (C) Mean error as a function of the signal to noise ratio, with uncorrelated white noise in both ears. (D, E, F) Performance of the model using AdEx neurons in place of LIF neurons (as in Figure 6).

