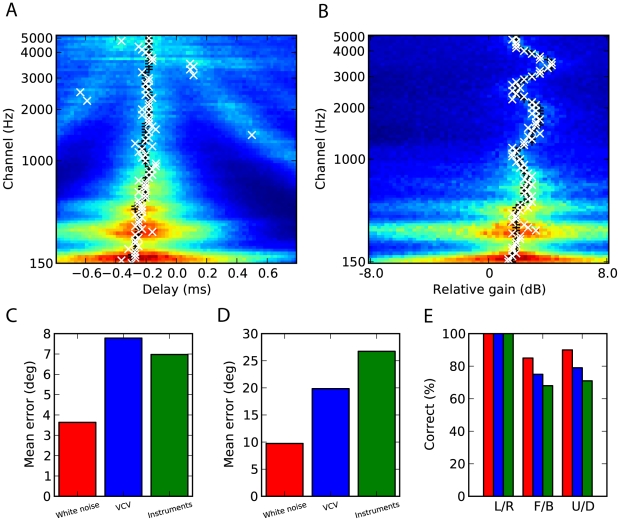
Figure 10. Learning delays and gains.
(A, B) Response of a population of postsynaptic neurons with various preferred frequencies, interaural delays and gains to a long broadband sound (10 s) played at a particular location. (A) Maximum neural response (color-coded) over all the gains, for each frequency and relative delay. (B) Maximum neural response over all the delays, for each frequency and relative gain. In both (A) and (B), the white x symbols show the maximum response for each frequency, and the black+symbol shows the choice of best delay (A) and relative gain (B) for that location in the approximate model, based on the cross-correlation of HRIRs. (C, D, E) Performance of the approximate model (as in Figure 8) using delays and gains learned from hearing 7 example sounds of 1 s duration from each location.

