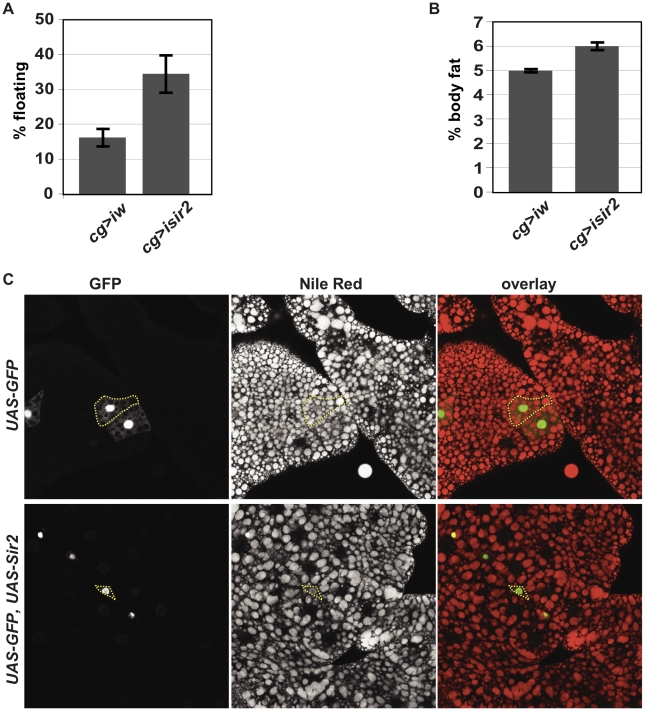
Figure 2. FB-specific manipulation of Sir2: knockdown increases organismal fat, whereas overexpression depletes lipid stores.
(A) Floatation percentage and (B) %TAG per body weight of FB-specific Sir2 depletion (“cg>isir2”) compared to control (“cg>iw”). Values represent averages of nine independent biological replicates for floating values and seven replicates for body fat; error bars, SEM. All lines are in the same genetic background, w1118. Floatation (data not shown) and %TAG for control UAS-Sir2RNAi animals lacking the Gal4 driver (5.6%±0.1%) were indistinguishable from Gal4-less UAS-wRNAi (5.6%±0.1%). (C) Larval FB tissue from animals ectopically expressing in clones of cells (green) GFP alone (top row) or GFP and Sir2 (bottom row) generated by FLP-mediated recombination (as described in Materials and Methods), stained with the lipophilic dye Nile Red (middle column; red in right column). Dashed yellow lines outline single cells, as assessed by GFP fluorescence. Clones were obtained without induction of flp, relying on “leaky” flp expression during FB development.

