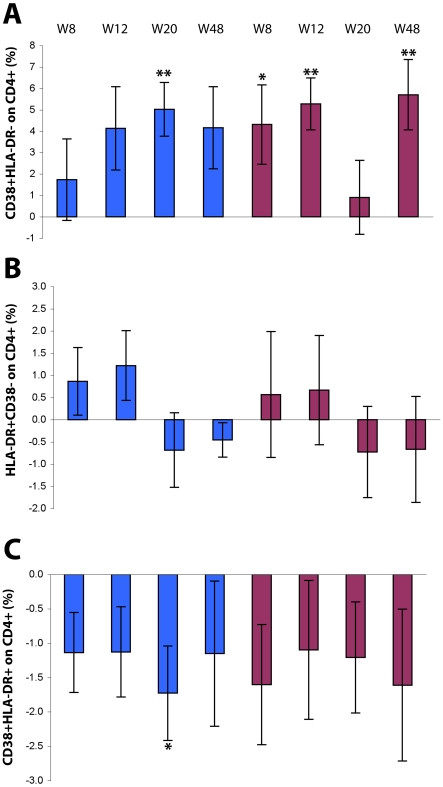
Figure 5. Expression of activation markers on CD4+ T cells after Tat immunization.
Changes from baseline of CD4+ T cells (gating on CD4+ T cells) expressing (A) CD38, (B) HLA-DR, or (C) both CD38 and HLA-DR. Results are shown according to Tat dose and time after the first immunization. Data are presented as the mean % changes (± standard error) at week 8, 12, 20 and 48. Blue bars: Tat 7.5 µg, n = 17 up to week 20 and n = 12 at week 48; red bars: Tat 30 µg, n = 20 up to week 20, n = 15 at week 48, respectively; The t-Test for paired data was used for the analyses: *p<0.05, **p<0.01.

