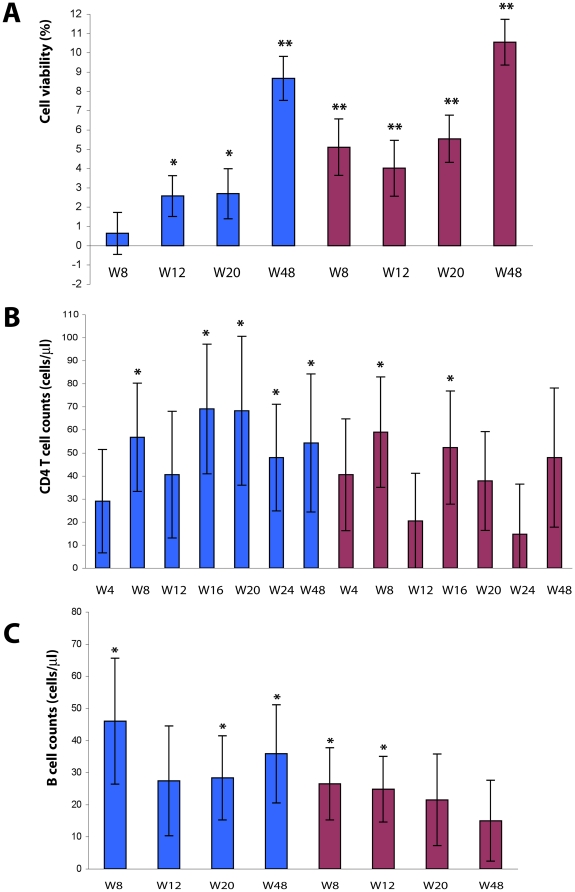
Figure 9. Evaluation of PBMC viability, CD4+ T cell and B cell counts after Tat immunization.
(A) Changes from baseline of in vitro PBMC viability, stratified by Tat dose. Blue bars: Tat 7.5 µg, n = 35 up to week 20 and n = 32 at week 48; red bars: Tat 30 µg, n = 40 up to week 20 and n = 33 at week 48, respectively. (B) Changes from baseline of CD4+ T cells/µL (data from clinical sites), stratified by Tat dose. Blue bars: Tat 7.5 µg, n = 39 up to week 24 and n = 30 at week 48; red bars Tat 30 µg, n = 43 up to week 24 and n = 34 at week 48. (C) Changes from baseline of B cells/µL, stratified by Tat dose. Blue bars: Tat 7.5 µg, n = 38 up to week 20 and n = 30 at week 48; red bars Tat 30 µg, n = 40 up to week 20 and n = 30 at week 48, respectively. The t-Test for paired data was used for the analyses: *p<0.05, **p<0.01.

