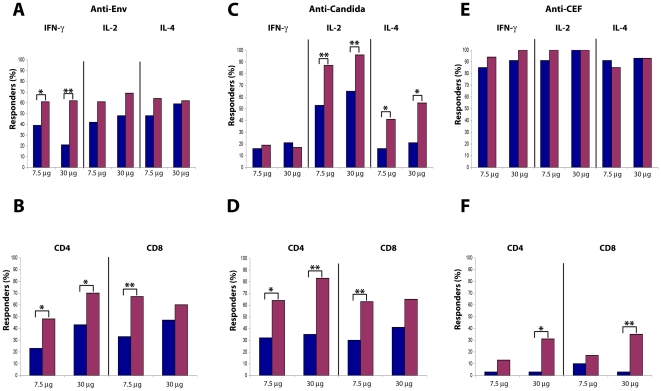
Figure 13. Cellular immune responses against Env or recall antigens after Tat immunization.
Percentage of responders at baseline (blue bar) and up to week 48 (red bar) are stratified by Tat dose. Percentage of subjects showing (A) anti-Env production of IFN-γ, IL-2 and IL-4 (Tat 7.5 µg, n = 31; Tat 30 µg, n = 29) and (B) CD4+ or CD8+ lymphoproliferative responses (Tat 7.5 µg, n = 31; Tat 30 µg, n = 30); (C) anti-Candida cytokines production (Tat 7.5 µg, n = 32; Tat 30 µg, n = 29), and (D) CD4+ or CD8+ lymphoproliferative responses (Tat 7.5 µg, n = 31; Tat 30 µg, n = 29); (E) anti-CEF production of IFN-γ, IL-2 and IL-4 (Tat 7.5 µg, n = 34; Tat 30 µg, n = 32), and (F) CD4+ or CD8+ lymphoproliferative responses (Tat 7.5 µg, n = 31; Tat 30 µg, n = 29). The analysis was performed using the McNemar's test: *p<0.05, **p<0.01.

