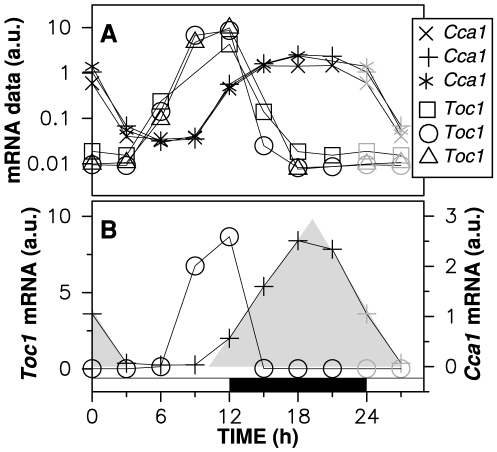
Figure 1. Microarray data recorded under 12∶12 LD alternation.
Time zero corresponds to dawn. (A) Experimental data points for the Cca1 and Toc1 mRNA time profiles [21] are drawn in logarithmic scale. Data points at zeitgeber time (ZT) 0 and ZT3 have been replicated in gray at ZT24 and ZT27. The target Toc1 and Cca1 profiles selected for subsequent analysis are shown with circles and pluses, respectively. These two profiles are also shown in linear scale in (B), where the shaded area illustrates the sawtooth shape of the Cca1 mRNA profile, which will be used later as evidence of a strongly saturated enzymatic degradation. This area has been obtained by fitting a straight line through Cca1 data points at ZT12, ZT15 and ZT18 on one hand and at ZT21, ZT0 and ZT3 on the other hand.

