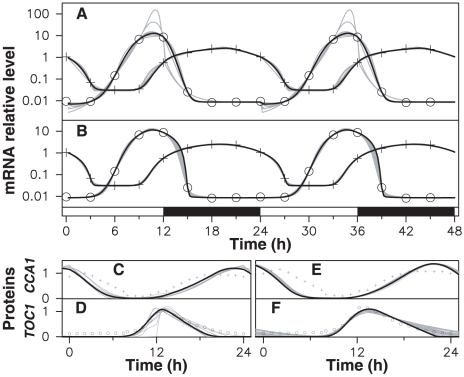
Figure 2. Adjustment of experimental data.
The data of Fig. 1(A) are adjusted by model (2) with a FRP of 24 hours. In (A) and (B), crosses (resp. circles) indicate the Cca1 (resp. Toc1) microarray data used as target. Solid lines are best-fitting mRNA time profiles (log scale) obtained with models where (A) all parameters are coupled to light; (B) no parameter is coupled to light; a few solutions near optimum are shown in gray with the best one in black. (C) (resp. (E)) solid lines are CCA1 predicted time profile (linear scale) corresponding to (A) (resp. (B)) with the same color code; crosses correspond to luminescence signals from translational fusion lines. (D) and (F) are the same curves as (C) and (E) for the TOC1 protein.

