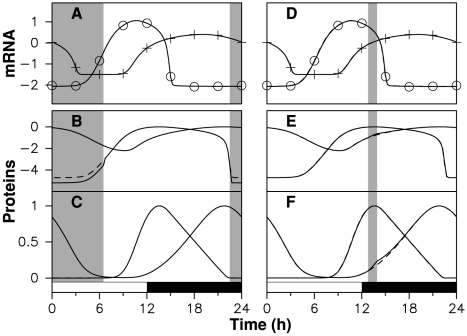
Figure 3. Adjustment by models with gated coupling.
Numerical solutions of model (2) without coupling (dashed lines, same parameter values as in Fig 2(B)) and with coupling (solid lines). Gray areas indicate coupling activation. In the left (resp. right) column, TOC1 (resp. CCA1) degradation rate is multiplied by 3 (resp. divided by 2) from ZT22.5 to ZT6.5 (resp. from ZT12.8 to ZT13.95). (A), (D) mRNA time profiles; protein time profiles are shown in (B), (E) logarithmic scale and (C), (F) linear scale.

