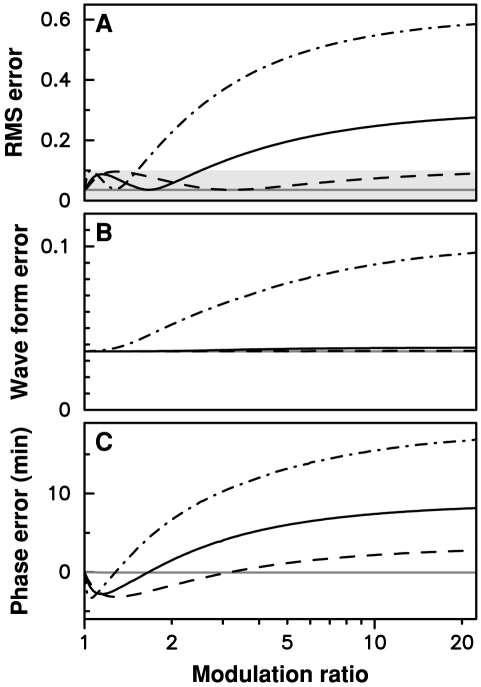
Figure 4. Adjustment error as a function of the coupling amplitude for three coupling windows.
(A) In gray, RMS error when  is multiplied by
  from ZT22.5 to ZT6.5; in black RMS error when
  is divided by
  from ZT12.8 to ZT13.95 (solid), from ZT13 to ZT13.65 (dashed), and from ZT12 to ZT15.47 (dash-dotted). The shaded area correspond to adjustment RMS errors below 10%. (B) Waveform error, given by the minimal adjustment error obtained when a variable phase shift is applied to the entrained oscillations; (C) Phase error, defined as the phase shift for which the minimal adjustment error is obtained.

