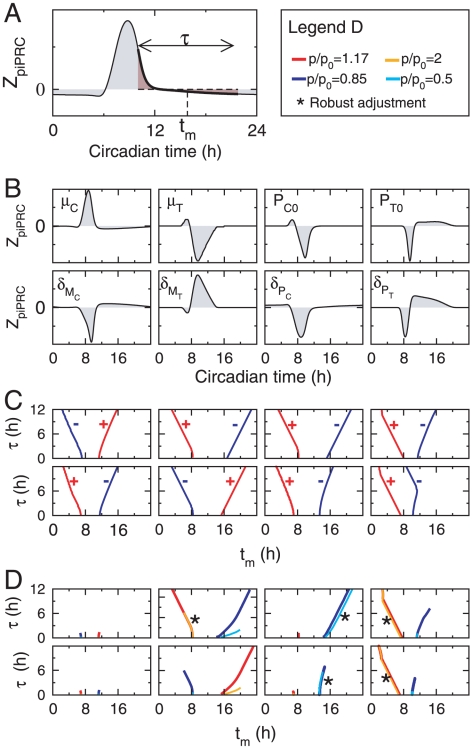
Figure 5. Characterization of coupling schemes.
(A) Schematic representation of how window center and duration  and
and  , which characterize a coupling with rectangular gating profile, are estimated from the piPRC using Eq. (1). (B) piPRC characterizing the phase change induced by an infinitesimal perturbation of some parameters of the model (transcription an degradation kinetics). (C) Characterization of window center
  and duration
  satisfying Eq. (1) for the coupling mechanisms shown in (B), as illustrated in (A). Parameters chosen in (B) are modulated either positively (red) or negatively (blue). (D) Characterization of window center and duration of gated couplings which adjust experimental data with a RMS error below 10% for two different coupling strengths (see box on the right-hand side of the top:
  is the ratio between the parameter values within and outside the coupling window).

