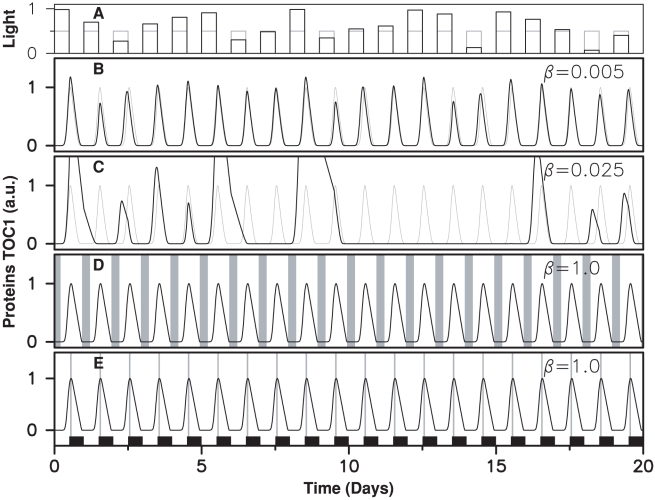
Figure 8. Response of clock models to fluctuating daylight intensity.
(A) Light intensity varying randomly from day to day. The time evolution of TOC1 concentration is shown for: (B), (C) the permanently coupled clock model of Fig. 2(A) at two different fluctuation levels, which are quantified by parameter  (see Methods); (D) the clock model used in Fig. 3(A)–(C); (E) the clock model used in Fig. 3(D)–(F). When the clock operates nominally, numerical solutions (in black) and experimental time profiles (in gray) superimpose.

