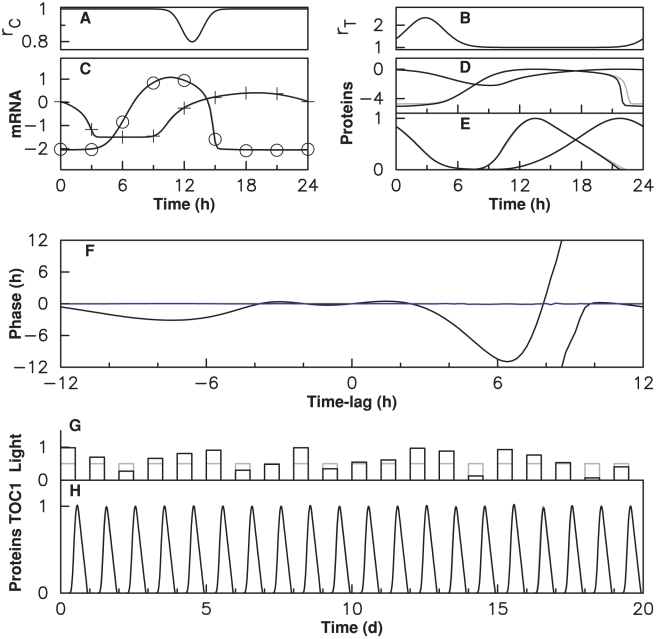
Figure 10. Dynamical behavior of a clock model with gating by Gaussian-shaped modulation profiles.
(A) Temporal profile of the CCA1 protein stability modulation coefficient  (
( ,
,  ,
,  ) (B) Temporal profile of the TOC1 protein stability modulation coefficient
  (
( ,
,  and
and  ). (C), (D) and (E) display numerical solutions of model (2) without coupling (in gray, same parameter values as in Fig 2(B)) and with coupling shown in (A) and (B) (in black). In (C) crosses (resp. circles) indicate the Cca1 (resp. Toc1) microarray data used as target. Protein profiles are shown in (D) (logarithmic scale) and (E) (linear scale). (F): Resetting of the clock after a phase-shift of the day/night cycle. Solid curves display the residual phase shift of the clock after 1 (black) and 5 (blue) day/night cycles as a function of the initial phase-shift. (G) Fluctuating daylight intensity (H) Response of the clock model with smooth coupling profiles to these fluctuations. The protein stability coefficients
  (see Methods) depend on daylight intensity
  according to
  .
.

