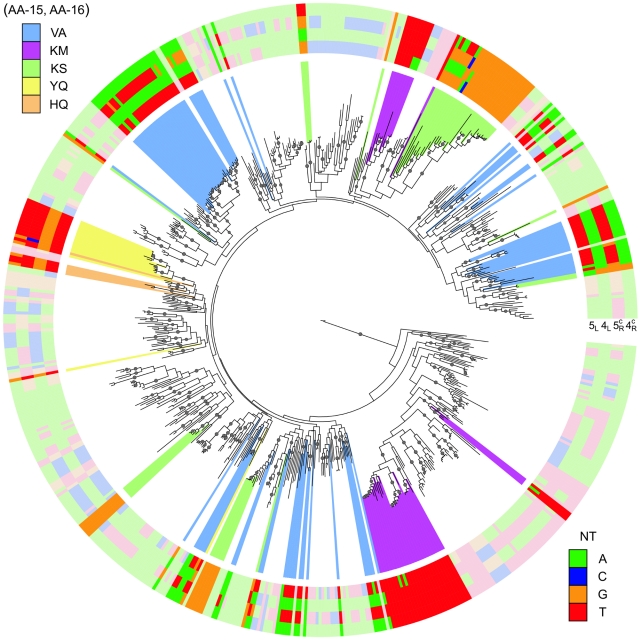
Figure 5. Convergence of binding modes in the gene tree.
Gene tree involving all TFs with BSs in Table S1 (623 TFs) plus the 3 TFs with  binding to natural SymL-like BSs (Fig. 4.C and Table S2). Only one BS per TF is shown. The external color code displays the specificity-associated positions –to help visualization of palindromic combinations right positions are read in the complementary (c) strand:
  . The color background in several branches corresponds to different recognition AAs (only a few recognition classes were enhanced). External color code in these branches shows darker colors to help visualization. Dots in branches denote bootstrap values larger than 80 (for 100 trees total, see Fig. S4 for more details).

