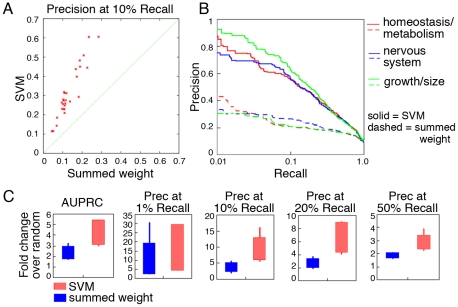
Figure 2. Significantly improved performance of our network-based SVM method for predicting well-defined phenotypes.
Thirty well defined, high level MP terms were obtained from MGI [37], which represent a wide sampling of phenotypes. A. Precision at 10% recall is shown for these 30 MP terms using our method (SVM; y-axis) and the summed weight method (x-axis). B. Precision-recall curves for an indicative selection of three high level phenotypes for our SVM-based method and the summed weight method. Full results for all examined phenotypes are available at the supplementary website (http://cbfg.jax.org/phenotype) and in Supplemental Figure S1. C. Box and whisker plots comparing our SVM approach to summed weight using several different summary statistics, including AUPRC (area under the precision recall curve), precision at 1%, 10%, 20% and 50% recall, each expressed as fold change over random precision. In all cases our approach outperforms the summed weight method.

