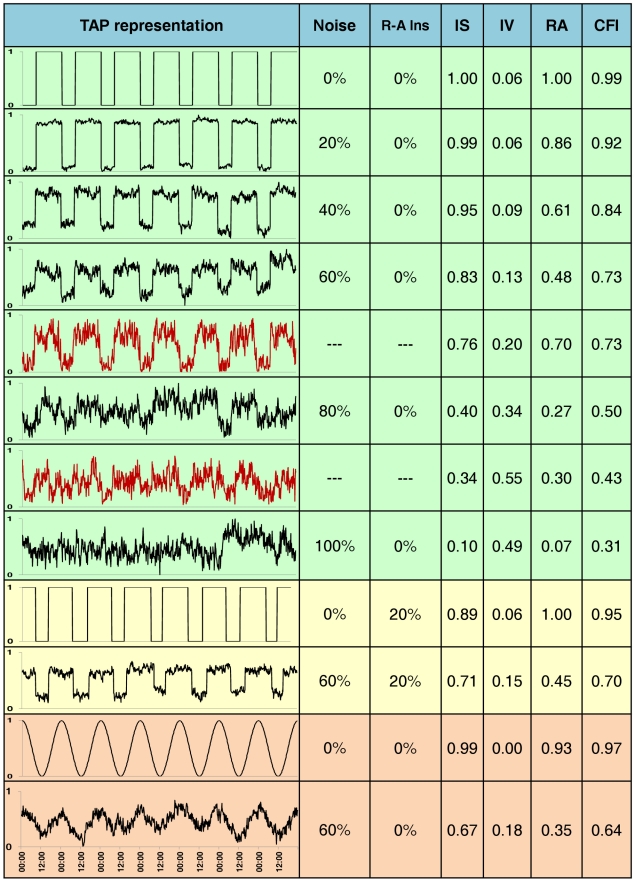
Figure 5. TAP simulations.
On the first column, TAP patterns obtained from simulations performed on Syntesi (Diez-Noguera, Barcelona, 2007) are shown. These simulations are drawn on black and subject's real TAP pattern on red. The noise percentage employed for modelisation (% noise) and percentage of instability in rest-activity ratio (R-A Ins) are shown in the second and third columns, respectively. Calculations of interdaily stability (IS), intradaily variability (IV), relative amplitude (RA) and circadian function index (CFI) for every model or real case are also indicated. Note that IS, IV, RA and CFI's units are AU. Green shadow indicates simulations performed on squared waves under different noise levels (while the same R-A Inst is maintained) and subject's real TAP pattern. Yellow shadow indicates simulations performed on squared waves under a 20% of R-A Inst and two extreme noise levels. Orange shadow indicates simulations performed on sinusoidal waves under two different noise levels (while the same R-A Inst is maintained).

