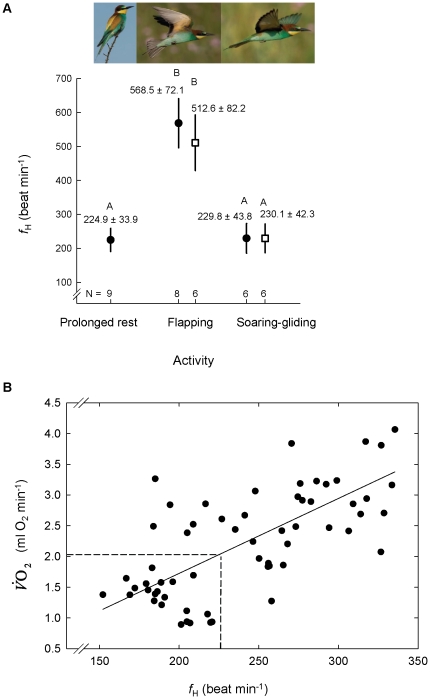
Figure 8. (A) Heart beat frequency ( f
H) of European bee-eaters measured in the field in relation to bird behavior, and (B) Laboratory  relationship.
In panel A the symbols represent mean ± standard deviation f
H of bee-eaters resting for prolonged duration and in different flight modes recorded during stopovers (filled circles) and migratory cross-country flights (open squares). Different letters above the bars indicate groups that differed statistically. N = number of birds whose f
H was recorded during each activity. The photographs above the figure depict each activity (photo credits: Daniele Occhiato). In panel B the trend line is illustrated following a major axis model II regression with N = 63; see Table 2 for regression statistics. Dashed vertical line indicates the average soaring-gliding f
H recorded in the field, and the dashed horizontal line depicts the corresponding  value.

