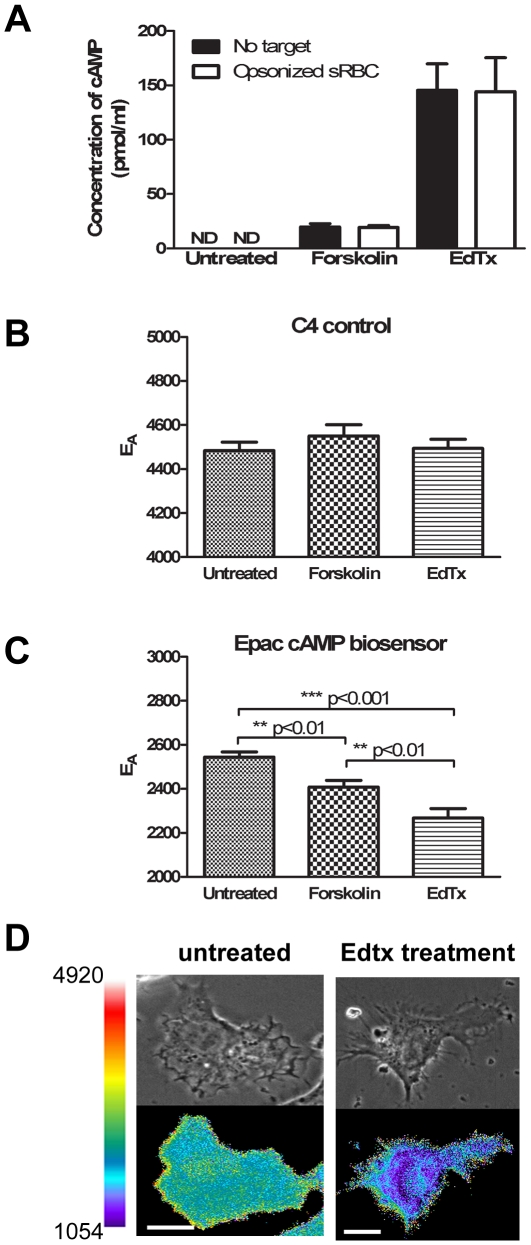
Figure 1. Changes in cAMP measured by biochemical and FRET microscopic methods in macrophages.
A. RAW cells were plated overnight at 2×10⁶ cells per well and stimulated with 200 µM forskolin for 20 min or with EdTx for 3 h. During the final 20 min incubation, either PBS (blank bars) or opsonized sRBCs (open bars) were added to cells as indicated. Total cAMP was quantified as described in material and methods. Data represent the mean ± SEM. B. and C. Cells expressing C4 control (B) or the Epac-camps biosensor (C) were either analyzed directly or following treatment with the indicated compounds. The relative amount of FRET after each condition was determined and the results are graphed as mean ± SEM (n = 50–100 cells per condition). D. A representative phase-contrast (top) and corresponding EA image (bottom) of an untreated or EdTx-treated macrophage. Color bar indicates scale of ratio and scale bar is 10 µm.

