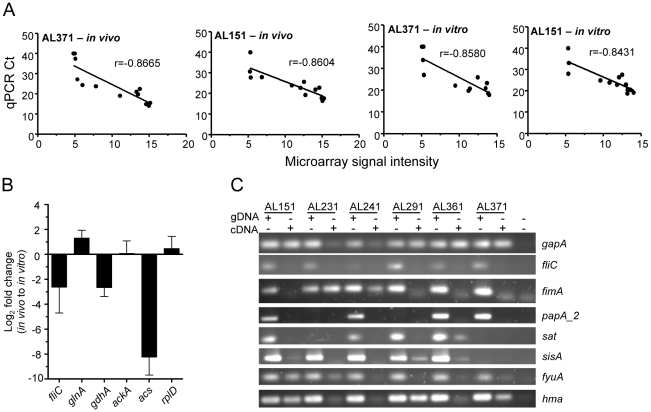
Figure 1. E. coli gene expression in voided urine from cystitis patients and culture in urine ex vivo.
(A) Correlation of gene expression levels obtained by microarray and qPCR. Ct values determined by qPCR are plotted for 13 genes (see text) versus normalized microarray signal intensity for in vivo (left two panels) and in vitro (right two panels) cDNA samples from patient isolates 371 (first and third panel) and 151 (second and last panel). Correlation coefficient (r) values are shown and P<0.001 for all correlations. (B) Genes differentially expressed during UTI in women and culture in urine ex vivo. Log2 fold changes in vivo, compared to in vitro expression, were measured by qPCR and are normalized to gapA transcript. (C) Confirmation of in vivo gene expression by clinical isolates as shown by PCR using genomic DNA or cDNA template.

