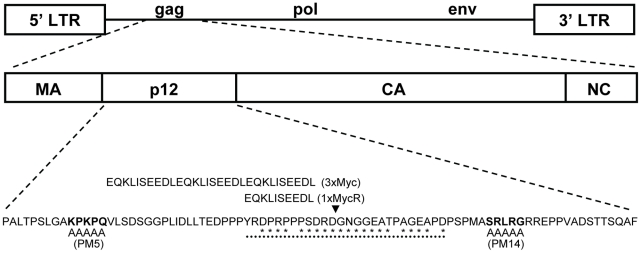
Figure 1. Schematic representation of MLV genome, p12 sequence and mutations.
Schematic representation of MLV genome with an expanded view of the gag gene, demonstrating the MA, p12, CA and NC domains. The p12 protein sequence is aligned with the alanine blocks in PM5 and PM14 viruses, which replace the wt residues (in bold) in these mutants [31]. Insertion sites in p12 of the Myc epitope sequences are marked with an arrowhead. The black dots are aligned with a region that was found to tolerate mutations in previous studies [28], [31], and residues in this region that were found to be relatively variable by phylogenetic analysis (Materials and Methods) are marked with asterisks.

