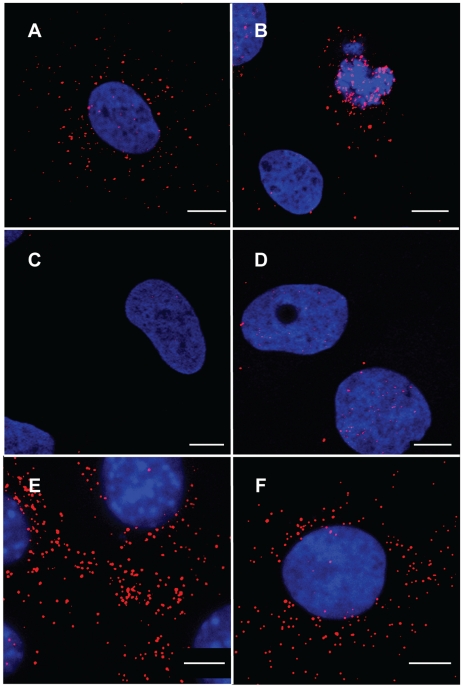
Figure 3. Immunofluorescence analysis of 1xMycR or wt -infected cells.
Representative images of U/R (A, B, C and F), U2OS (D), or NIH3T3 (E) cells that were infected with 1xMycR (A, B, D, E and F) or wt (C) viruses. 12 h postinfection the cells were stained with DAPI, anti-Myc monoclonal antibody and a secondary, Cy-3-conjugated, anti-mouse antibody. Serum starvation and aphidicolin treatment were applied to arrest the cell cycle prior and during the infection (F). Cultures were visualized with LSM 510 META confocal microscope (Zeiss) (A, B, C, D and F), or with spinning disk confocal (Yokogawa CSU-22 Confocal Head) microscope (Axiovert 200 M, Carl Zeiss MicroImaging) (E). Bars represent 10 µm.

