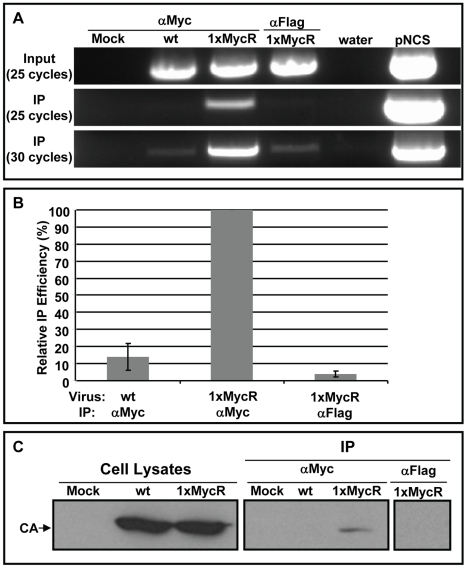
Figure 8. Co-IP of p12 with the viral genomic DNA and CA proteins.
Lysates were prepared from NIH3T3 cells, infected with wt or 1xMycR viruses. To detect the viral genomic DNA (A and B) the lysates were incubated with anti-Myc (labeled ‘αMyc’), or control anti-Flag antibodies (labeled ‘αFlag’); both conjugated to protein G magnetic beads. Viral genomic DNA was PCR amplified from cell lysates (labeled ‘Input’) and from the magnetic beads (labeled ‘IP’) with MLV specific primers. After 25 and 30 cycles of amplification, the PCR products (875 bp long) were electrophoresed in 1% agarose gels containing ethidium bromide (A). ‘Mock’ indicates mock-infected NIH3T3 cells. Water and plasmid encoding the MLV genome (‘pNCS’) were used as negative and positive PCR controls, respectively. (B) The ‘Relative IP efficiency’ of the viral genomic DNA was quantified by qPCR (Materials and Methods) and is presented as the means ± the standard error of the means, obtained from three independent experiments. The qPCR values are presented in Fig. S7A. To test for CA immunoprecipitation (C), NIH3T3 were infected as in (A) and 15% of the indicated cell lysate was used to determine total CA levels (labeled ‘Cell Lysates’). The remaining lysates (labeled as in A) were used for IP with anti-Myc, or control anti-Flag monoclonal antibodies, bound to agarose beads. Cells exposed to medium with no virus served as a mock control. Pellets (labeled ‘IP’) and cell lysates were analyzed by Western Blot, using anti-CA polyclonal antibodies.

