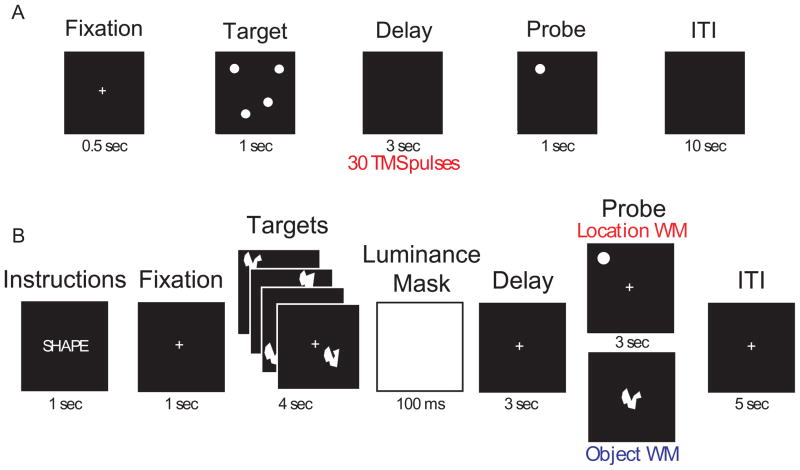
Figure 1.
A. Schematic diagram of the task used in Study 1. In half the trials, rTMS (10 Hz, 110% MT, corrected) was delivered throughout the entire 3-sec delay period (marked by the red bar). Task procedures were the same in both Experiment 1 and Experiment 2. B. Diagram of the task used in the rTMS-EEG study. For each brain area targeted (SPL and S1), subjects performed 192 memory trials (96 location memory and 96 object memory, randomly interleaved). On half the trials, orthogonal to the factor of memory task and randomly distributed, a 3-sec train of 10-Hz rTMS (30 pulses) coincided with the onset of the delay period.

