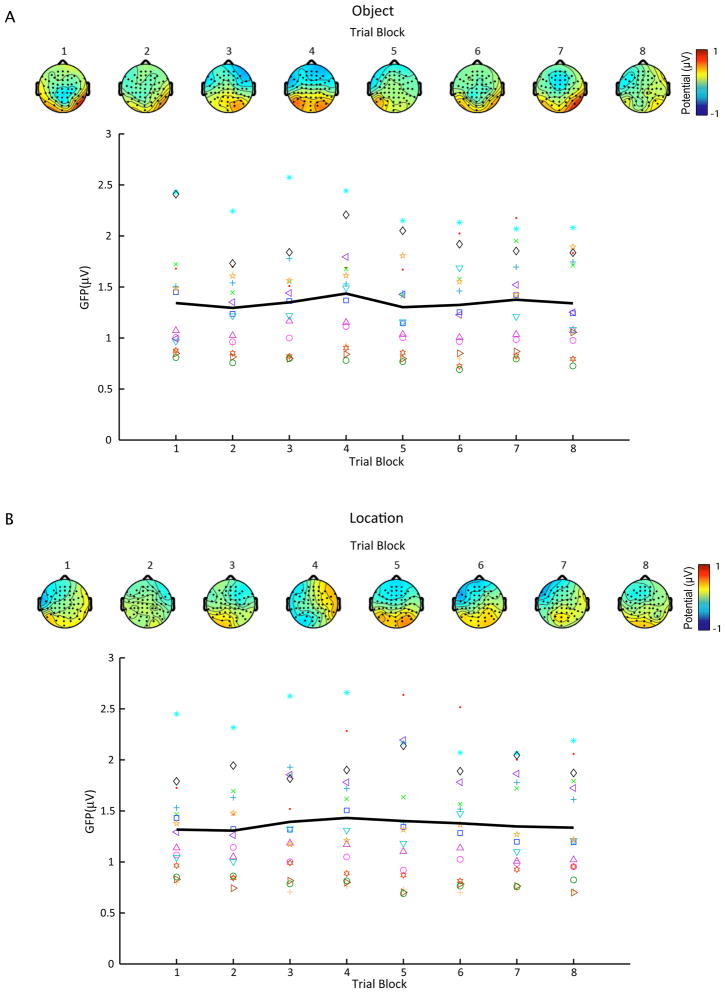
Figure 6.
Mean delay-period GFP for S1/rTMSabsent trials as a function of task block for both object- (A) and location-memory (B) conditions. Different marker types indicate mean GFP across blocks for each subject, whereas the black line represents average GFP across subjects. Scalp maps show the topography of group-averaged delay-period potentials for each block.

