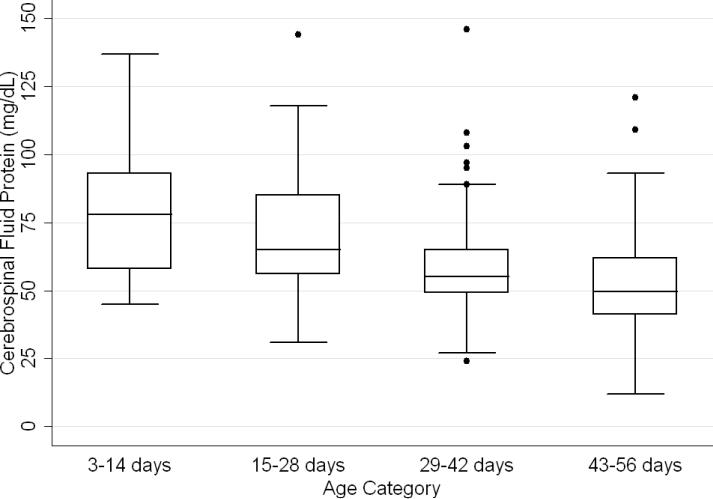
Figure 2.
Boxplot showing variation in cerebrospinal fluid protein concentrations by age category. The line in the middle of the box denotes the median value. The ends of the boxes represent the interquartile range (i.e., 25th and 75th percentile) values. The whiskers extend 1.5 times the interquartile range values and the circles denote extreme outlying values.

