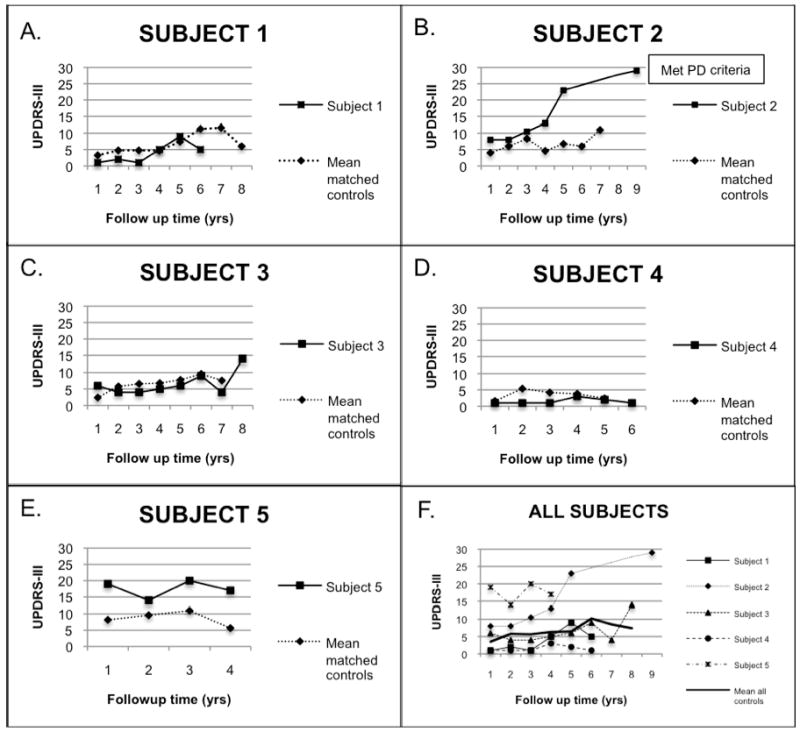
Figure 1.

Longitudinal UPDRS-III ratings in LRRK2 G2019S carriers and controls
Figures A-E are graphic representations of UPDRS-III scores over time of the different subjects compared to the mean of their matched control set. Subject 2 had missing UPDRS-III points from years 6-8. In Figure F, mean UPDRS-III scores are presented for all subjects and controls using the same Y-axis scale.
