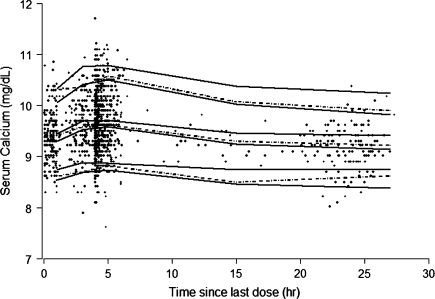
Fig. 2.
Visual predictive check of final PK–PD model. Solid lines represent the 90% confidence intervals for the 5th, median, and 95th percentiles of model simulated results. Dotted lines represent the 5th, median, and 95th percentiles calculated from the observed data. Data were binned in ranges of 0–2, 2–4, 4–6, 6–24, and 24–30 h for the calculation of percentiles. The observed data are overlaid for reference

